Single cell resources at UCSC
Single cell experiments measure tens of thousands of gene loci in thousands of cells at the same time. That resulting data is challenging to visualize. The UCSC Genome Browser is adding published datasets as tracks and an entirely new data exploration tool:
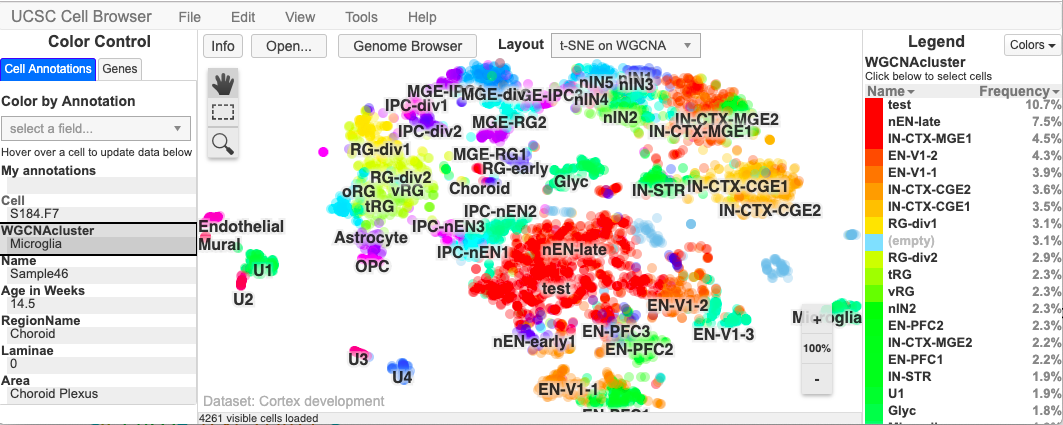
- UCSC Cell Browser
- Interactively color dimensionality reduction plots by cell annotation or genes
- Tabula Muris
- Genome Browser track showing single cell RNA-seq gene expression, genome coverage and splice sites
UCSC Cell Browser
The UCSC Cell Browser is a fast, lightweight viewer for single-cell data. You can:
- View 2D plots of cells arranged by algorithms such as t-SNE or UMAP
- Color cells by metadata and gene expression
- View cluster marker genes and selected dataset-relevant genes
- View heatmap showing selected gene expression across clusters
- Rename clusters and add custom annotations to a selected set of cells
Single cell datasets in the UCSC Genome Browser
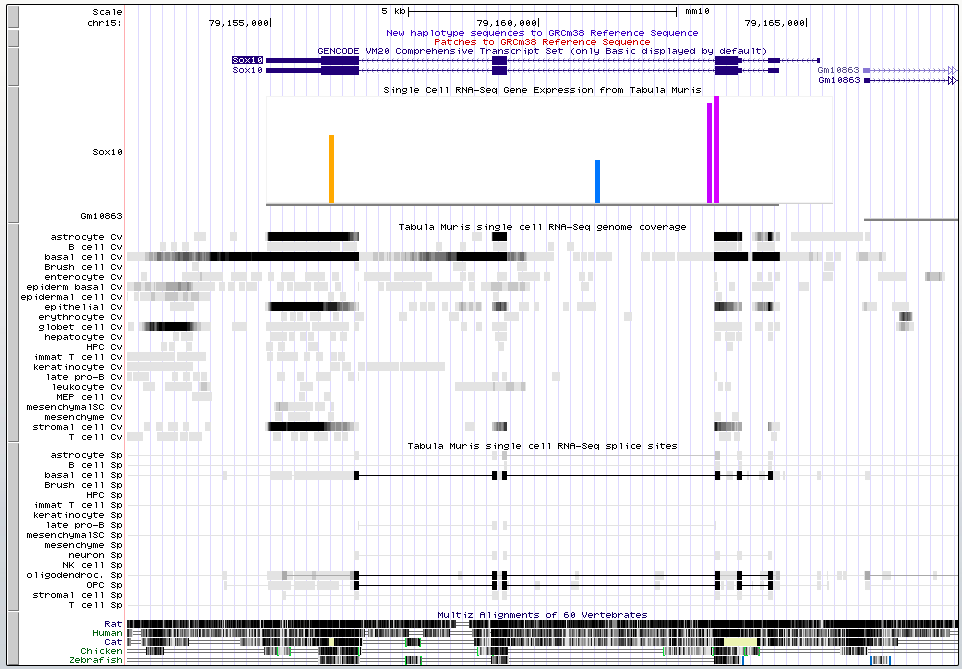
Below is a screenshot of a public session that highlights the Tabula Muris gene expression track. The session shows the Sox10 locus. The gene expression track at the top shows that the gene is only well expressed in basal cells (orange), mammary gland (blue) and oligodendrocytes (pink). These cell type names are shown when you hover with the mouse over the bars on the genome browser. The coverage tracks below show that all exons are transcribed in these, but the last exon is also transcribed in stromal cells and some non-coding transcription is seen in goblet cells 3' of the gene. The splicing tracks below show that proper splicing is limited to the four cell types described above. This is also a non-coding region conserved in zebrafish and chicken.

